Zimbabwe Command Agriculture Programme

ARTICLE LINK

http://allafrica.com/stories/201711060096.htm

“Zimbabwe: Farmers Fail to Repay Command Agriculture Loans.” AllAfrica, NewZimbabwe, 3 Nov. 2018, allafrica.com/stories/201711060096.htm.


SUMMARY

The Zimbabwe government implemented a program called the Command Agriculture Programme that grants beneficiaries inputs, irrigation and mechanical equipment to harvest. Beneficiary farmers must plant and grow the maize themselves, and in return they bring their harvested maize to the Grain Marketing Board. When it came time for farmers to deliver their maize, many reported various reasons as to why they couldn’t: loss of crops due to weather, loss of crops due to fire, lack of rain or that they are still harvesting the maize. What Agritex, a company who “generates, provides and promotes agricultural programs”, discovered, was that farmers were actually selling their harvested maize to middlemen (MOA). These middlemen were giving the farmers instant cash, and turned around and sold the maize back to the Grain Marketing Board. This essentially means that the Grain Marketing Board was losing money. According to Agritex, only $60m of the $500m loaned was returned (All Africa).

The Zimbabwe government is now forced to create new requirements for the agriculture program due to the unpaid loans and trying to prevent this from happening repeatedly. These new requirements mean that inputs are only going to be given to farmers who have repaid their previous loans and farmers that are participating in this program for the first time.

President Mnangagwa believes that the program’s dismay was due to G40 (Generation 40), a “cabal of the younger, more educated generation”. He stated “Following the resounding success of the Command Agriculture Programme, its detractors moved in and threw spanners in the works. They delayed in securing inputs, but from now onwards rest be assured that all inputs will be availed on time.” (Herald).


ANALYSIS

While this can be attributed to many other issues, such as theft of inputs by both farmers and government officials, late distributions and non-delivery of inputs to the farmers, and disagreements inside the government of how to execute the program, the key issue at hand here is ex-post moral hazard.

Merriam-Webster defines ex-post as a Latin term for “from a thing done afterward” and moral hazard as “the possibility of loss to an insurance company or arising from the character or circumstances of the insured”. In this example, ex-post moral hazard is being displayed when the farmers are successful in growing the maize, and then lies about it to the government in order to cheat the system.

The Grain Marketing Board lends the inputs, equipment and irrigation to beneficiaries with the intention of buying their harvested crop at a lower price than market price. They do this instead of charging an interest rate to the farmers. Selling their harvested maize to the GMB for a lower price than market is the cost farmers must incur. However, farmers are skipping this part of the program and using middlemen to get instant cash and cheat the system.


STRATEGIES

The article itself introduces the new requirements: only people who have never participated in the program and farmers who have previously repaid can join in. In addition to this, the program could take other measures, such as provide additional incentives, or have a monitoring program that catches and punishes the deceitful beneficiaries.

 Incentives

Now that the program has announced the restrictions, they are basically using the desire to re-enroll in this program as an incentive. If you want to continue receiving the benefits of the program, you must repay your loan. But this is only an incentive if the farmer does want to rejoin the program, they still have the freedom to be a first time participant and sell to middlemen. Other incentives would work if the program provided the incentives after the farmer has sold their maize to the Grain Market Board. The farmers are selling their maize because they are getting a better deal, so the goal of the incentive must be to provide a better benefit than that of being deceitful. Tax exemptions can be a crucial way for governments to promote economic development strategies (Francis, 2016).

 Monitoring programs/ punishment

In order for a monitoring program and punishment system to work, the monitoring program must cost the Grain Marketing Board less than the cost of their loss from the deceitful farmers and the punishment system must make farmer’s losses smaller than if they got away with the cheating. With ex post moral hazard, the monitoring program must be efficient, reliable and cheap. The monitoring program must find the optimal fine in which controls the ex post moral hazard (Puelz and Snow, 1997).

In order to do so, our in-class analysis looks at the math behind this.

-Farmer begins with wealth (w)

-Farmer succeeds (y) with probability (p), fails (0) with probability (1-p)

-When the project succeeds, farmer repays (r), i.e. sells maize back to GMB, and if it fails, pays back (0)

-If farmer cheats, he is caught and loses (w) with probability (s)

-GMB can monitor with monitoring cost (m) and the truth about the farmer is uncovered with probability (s)

-If farmer is caught cheating, he must pay back (r) as well as punishment (d)

From all of this, we understand that in order for GMB to monitor, m < rsp, i.e. the cost of monitoring should be less than the interest rate times the probability of uncovering the truth times the probability the farmer was successful in the first place. Also, d > (r(1-s)/s), i.e. the punishment (d) must be greater than the interest rate times the probability he is not caught divided by the probability he is caught.

Overall, President Mnangagwa has the right idea, and is moving both the Command Agriculture Programme and Zimbabwe in the right direction of economic success, but analyzing the cost and benefits of incentives and a monitoring/punishment program could further the success.


WORKS CITED, REFERENCES

http://www.moa.gov.zw/index.php/programmes/

“Programmes.” Ministry of Lands Agriculture Rural Resettlement, http://www.moa.gov.zw/index.php/programmes/.

https://www.herald.co.zw/zim-attracts-3bn-fdi-in-7-weeks-ed/

Herald. “Zim Attracts $3bn FDI in 7 Weeks: ED.” The Herald, The Herald, 8 Feb. 2018, http://www.herald.co.zw/zim-attracts-3bn-fdi-in-7-weeks-ed/.

https://fee.org/articles/middlemen-and-markets/

Davies, Stephen. “Middlemen and Markets.” FEE, Foundation for Economic Education, 30 May 2012, fee.org/articles/middlemen-and-markets/.

http://www.moa.gov.zw/index.php/departments/

“Departments.” Ministry of Lands Agriculture Rural Resettlement, http://www.moa.gov.zw/index.php/departments/.

https://www.merriam-webster.com/dictionary/ex%20post%20facto

“Ex Post Facto.” Merriam-Webster, Merriam-Webster, http://www.merriam-webster.com/dictionary/ex%20post%20facto.

https://www.merriam-webster.com/dictionary/moral%20hazard

“Moral Hazard.” Merriam-Webster, Merriam-Webster, http://www.merriam-webster.com/dictionary/moral%20hazard.

https://www.jstor.org/stable/pdf/41760849.pdf?refreqid=excelsior%3Ae27fc1da7e6d25c0b2f8d23760657878

Puelz, Robert, and Arthur Snow. “Optimal Incentive Contracting with Ex Ante and Ex Post Moral Hazards.” JSTOR, Springer, Mar. 1997, http://www.jstor.org/stable/pdf/41760849.pdf?refreqid=excelsior%3Ae27fc1da7e6d25c0b2f8d23760657878.

https://www.urban.org/research/publication/state-tax-incentives-economic-development

Francis, Norton. “State Tax Incentives for Economic Development.” Urban Institute, 1 Feb. 2017, http://www.urban.org/research/publication/state-tax-incentives-economic-development.

https://www.federalreserve.gov/pubs/bulletin/2008/articles/econdevelopment/default.htm

Gorin, Dan. “Economic Development Incentives: Research Approaches and Current Views.” FRB: IFDP Notes: The Effects of Demographic Change on GDP Growth in OECD Economies, Board of Governors of the Federal Reserve System (U.S.), 2007, http://www.federalreserve.gov/pubs/bulletin/2008/articles/econdevelopment/default.htm.

Land Reform in the Philippines

By: Sam Besse

Source article: http://www.manilatimes.net/boost-phs-food-security-president-tells-farmers-2/390370/

You’ve probably heard of President Rodrigo Duterte of the Philippines since his recent election in 2016. He’s most famous for calling for the extrajudicial killing of drug users. He has also instituted land reforms as part of his populist campaign. The article I’ll be discussing is about Duterte’s continued support for agricultural reforms in the Philippines including increasing government subsidies for fertilizer and training.

Since it was occupied by the Spanish and then the Americans and then briefly by the Japanese, the Philippines has had a small set of very wealthy landowners who control most of the land. When the Philippines gained independence in 1946, some modest land reforms began to be implemented. This meant regulating the types of contracts that could be enforced and encouraging 70-30 sharecropping contracts with tenants gaining the greater share of land production. Under a simple model of land agreements, regulating the type of contract to increase the share of the tenant worker would be an effective means of increasing the income of the tenant because land owners have an incentive to hire labor as long as hiring workers produces a larger profit than the alternative. The farms were much too large to be managed by the owners so the plantation owners had little alternative but to change the contract structure.

Later, in 1988 the Philippine government passed the Comprehensive Agrarian Reform Law (CARL). This law and its amendments still govern land reform in the Philippines today. Under the provision of CARL discussed in the article the Philippine government buys large tracts of land from private owners and divides and distributes the land to small farmers. The small farmers do pay a discounted price for the land in the form of a loan taken out from the Land Bank of the Philippines. The small farmers then receive the benefits of education, irrigation, crop insurance, and credit for inputs like fertilizer. This program should increase the efficiency of the agricultural labor market if it solves the principal-agent problem that is known as the Marshallian problem. This problem is characterized by a non-alignment of incentives between the land owner and the laborers hired by the landowners. A sharecropper not receiving the total benefit of her labor will not work to the efficient level of effort. See Figure 1 below. Catalyzing the permanent transfer of land from large to small landowners who supply labor for their own lands is functionally similar to forcing the landowners to establish fixed rent contracts with their laborers. In both cases the worker, now the small landholder, receives the total benefit of her labor and will thus exert the efficient level of effort.

marshall
Figure 1: Driver of Inefficiency in Sharecropping


We’ve already established in class that the most efficient contract under a variety of circumstances is the fixed rent contract. The different contract types and their benefits under different circumstances are shown in Figure 2. The definition of efficiency in this context is that resources are optimally allocated to make all parties as well off as possible. The fixed rent contract is maximally efficient because the most efficient allocation of resources is one in which the marginal cost and marginal benefit of labor are equal. When a worker is entitled to all of the output of their labor they will work up to that point.

  No Risk Risk
Effort Observable Fixed rent – efficient

Wages – efficient

Sharecropping – efficient as long as effort is included in the contract

Fixed rent – efficient

Wages – efficient

Sharecropping – efficient as long as effort is included in the contract

Effort Unobservable Fixed rent – efficient

Wages – efficient

Sharecropping – efficient as long as returns are included in the contract

Fixed rent – efficient

Sharecropping – less efficient

Wages – least efficient

Figure 2: Matrix of Contract Type Efficiencies.

The fixed rent contract does have drawbacks, particularly that the worker must deal with all of the risk involved in farming. The worker is likely more risk-averse than the landowner due to wealth differences so this absorption of risk by the worker can be non-optimal. The difficulty is that if the worker and landowner agree to a different contract type that shifts more risk to the landowner, such as a sharecropping contract, the incentive to exert effort is at least partially removed.

CARL attempts to mitigate the problem posed by risk aversion by providing crop insurance to the new small farmers. However, crop insurance can also reduce efficiency by causing moral hazard. In this context moral hazard means that the farmer will not exert effort up to the efficient level because she knows that if the crop fails she will still receive some portion of the crop from the insurance scheme. This is usually mitigated by designing the crop insurance such that the farmer receives only a portion of the planted crop.

Another feature of the program is the splitting of land into smaller segments. Up until now we have assumed constant returns to scale. However, there are economies of scale in farming that arise from farming knowledge, irrigation, tractors, transportation of goods and other fixed capital costs. Splitting the farms into smaller segments could destroy these economies of scale and make agriculture less efficient. Again, CARL anticipates and attempts to mitigate these problems by providing for collective irrigation programs and spreading institutional knowledge.

CARP decades-long attempt to reduce poverty and increase the agricultural productivity has been only mildly successful. The recipients of the program have a poverty rate which is reduced from  47.6 to 45.2 percent, a relatively tiny change (Guardian 2003). The disappointing results of this program are most likely a result of the destruction of the economies of scale associated with large scale agriculture. It seems that Duterte will continue the mistakes of his predecessors by continuing to push the same agenda of land reform. These reforms are popular for the public but fail to make the promised impact.

Sources

Guardian, Edgar A. (2003). “Impact of access to land on food security and poverty: the case of Philippine agrarian reform”Land Reform, Land Settlement and Cooperatives. FAO (2)

Gomez, Eireen “Boost PH’s food security, President tells farmers” Manila Times. April 4, 2018. http://www.manilatimes.net/boost-phs-food-security-president-tells-farmers-2/390370/

Will Technology Solve Kenya’s Economy?

Examining the economic impact of increased investment in technology in Kenya.

Introduction

Technology is believed to be the key to the future by unlocking the answers to our problems of today. The level of technology a country has greatly impacts the country’s economy through both the demand and supply side. Recently it was reported by Elizabeth Merab at The Daily Nation that Melinda Gates has launched a new program called Pathways for Prosperity: A New Commission on Technology and Inclusive Development in Kenya. The point of the program will be to figure out ways to help advance technology in developing countries in a way that enriches the economy. Another key part of the program is making sure that all the efforts are equally distributed between the rich and the poor to help close the inequality gap. In this blog I will discuss the current problems facing Kenya’s poverty rate before moving into how technology impacts the economic models of output and income inequality.

Poverty in Kenya

Poverty levels in Kenya are still considerably high compared to other countries today. Currently over thirty six percent of the population in Kenya is living below the poverty line(World Bank). What this means for those living under the poverty line is that they are unable to meet the basic income needed to consume at the standard of living to survive. The issue that Kenya is facing the World Bank states, is that they are unable to transfer their steady growth domestic product(GDP) level to consumption making their reduction to the poverty rate miniscule each year.  This though isn’t their only problem when solving their poverty problem, because Kenya is also facing a massive inequality gap. Meaning that their richest twenty percent of the population makes eleven times more than their poorest twenty percent of the population(Business Daily). Both high poverty rates and high inequality rates are currently hurting Kenya’s economy.

Neoclassical Model and Technology

Having a better grasp on the current problems, we can begin to look at how technology would solve these problems. The World Bank stated that Kenya needed “higher and more inclusive growth rates”, which Melinda Gates believes her program will provide by having technology stimulate productivity. This stimulation of productivity would lead to an increase in GDP and eventually a decrease in poverty due to higher wages and higher levels of employment. To fully understand the impact of technology on Kenya’s economy it is important to first examine the Solow’s Neoclassical Model of Growth. This model shows the country’s economic growth by looking at its labor, capital, and productivity. Looking at the original model with technological constraint shows what Kenya’s steady state of economic growth would look like. The steady state is what all economies are striving for where there is no economic growth because they are at a perfect level where everything is equal.  This is would be marked by k on the graph.

maxresdefault


The impact of technology on the economy is best explained by looking at how it would impact it at its steady state. The increase in technology would shift the curve upwards due to an increase in productivity and labor, causing an increase in both the capital and output levels as shown in the diagram below.

maxresdefault-1

What this means is that economy would expand and the growth rate would increase. Increase in technology is believed to then have a positive impact on the reduction of poverty rate of a country. This kind of increase in productivity shown in the graph above will have a positive impact on everyone in the market. This kind of conclusion was also stated in a recent article by the Brookings Institute claiming that “technology can exponentially facilitate the achievement of development goals through rapid scale” (Chan).

Taking Down Inequality

The problem left over from the enhancement of technology would be the inequality gap. The reason this would still be an issue is that Melinda Gates wants to have the technology equally distributed between the rich and the poor(Merab). What this would do is cause everyone to increase their income as shown above at the same rate. This would shift more people over the poverty line, but would also move more people already above the poverty line higher. The gap wouldn’t decrease but just shift upwards as a fallout then from the technology.  The inequality gap doesn’t disappear with an increase in GDP and a decrease in poverty. Inequality gap has to be directly addressed because its deep rooted in the economic history of the country.

Conclusions

In conclusion technology can greatly impact the poverty levels of a country by increasing its productivity and GDP. An issue that can arise is that if technology is equally spread out among the people it won’t help in reducing the inequality in the country. The article states that the commission plans to do research on the best ways to implicate the new technology and hopefully that will help to solve this dilemma. When doing their research the commission should take into account the benefits of starting the technology with the poor before spreading it to the wealthy. Overall though this new program should benefit Kenya greatly in moving them towards a more prosperous economy.


Bibliography

Source Article :

Merab, Elizabeth” How Melinda Gates PLans to Promote Growth in Africa”. Daily Nation. January 28, 2018. Web. https://www.nation.co.ke/news/How-Melinda-Gates-plans-to-boost-growth-in-Africa/1056-4282486-nhhn23z/index.html


Wide wealth gap leads to calls for pro-poor policies”. Business Daily. August 25, 2014. Web. https://www.businessdailyafrica.com/news/Wide-wealth-gap-leads-to-calls-for-pro-poor-policies/539546-2429628-991358/index.html.


Chan, Rosana. “ Foresight Africa viewpoint: rethinking African growth and service delivery: technology as a catalyst.” Brooking Institute. January 12, 2018.Web. .https://www.brookings.edu/blog/africa-in-focus/2018/01/12/foresight-africa-viewpoint-rethinking-african-growth-and-service-delivery-technology-as-a-catalyst/

“Poverty Incidence in Kenya Declined Significantly, but Unlikely to be Eradicated by 2030”. World Bank. April 10, 2018. Web. http://www.worldbank.org/en/country/kenya/publication/kenya-economic-update-poverty-incidence-in-kenya-declined-significantly-but-unlikely-to-be-eradicated-by-2030


Economic Prosperity in India

By Keval Shah

Introduction

The International Monetary Fund (IMF) has stated that India should expect to see significant economic growth in the next two years, which will give the nation the title of fastest-growing economy word-wide. India is estimated to have a growth rate of 7.4% in 2019 and a growth rate of 7.8% in 2020 – which is a significant increase from this year’s growth rate of 6.7%.

Official estimates indicate that India’s growth will truly begin to take effect in the second half of this year, with growth rates increasing from 6.5% to 7%. India is also expected to see an increase in earnings during the October-December quarter of this year, which only provides more evidence in favor of this projection.

This two-year projected growth rate would mean that India will soon eclipse China in that metric, whose current growth rate of 6.8% will only see a decline in the next two years. Meanwhile, the United States is projected to have a growth rate of 2.5% on 2019.

Resurgence in India’s economy began to become apparent in December of last year. Automobile sales became robust, with passenger vehicles sales rising 5.2% and commercial vehicle sales rising 52.6%. Meanwhile, the stock market also began to surge, hitting new records on a weekly basis.

Accuracy of Projection

Compared to the projected economic growth of the United States, the growth rate of India seems relatively high. However, when you consider that the United States is a developed country the projection appears to be accurate. Generally speaking, developed countries have a much slower economic growth rate while developing nations have a much faster growth rate. With India being a developing nation, this projection makes sense in comparison to that of the United States.

India’s projection of higher earnings in the fourth quarter of this year also has significant implications on the accuracy of the projected growth rates. Higher monetary earnings for a nation will, by default, have positive impacts on the status of economic growth. With India expected to see higher earnings for its citizens during the months of October-December of this year, it only confirms the fact that the nation will see positive economic growth in the coming years.

Speaking of positive economic growth and higher income, the increase in automobile sales only reinforces this fact. A positive raise in automobile purchase rates indicates that the residents of India are becoming more well-to-do, which signifies an increase in economic well-being. As purchases – such as that of automobiles – increases, we know that the citizens of India are prospering economically, and that trend will surely continue in the coming years.

The Solow Model

One method economists use to project growth rates of a nation is the Solow Model. The Solow Model was created in 1956 By Robert M. Solow. The Solow Model utilizes inputs such as capital and labor in order to determine the future economic growth of a nation. When inputted into the model, capital and labor do justice in determining whether or not a nation will see economic growth or decline in the future.

The economic times of India has suggested that capital has significantly grown within the nation in recent years. “This may not bring cheer to the estimated 1 million youth entering the workforce every month. Capital is increasingly replacing labour in Indian industries. With the cost of labor jumping manifold, companies have preferred to employ a fewer number of workers and have instead focused on improving productivity amid a sharp increase in deployment of capital. While employment has grown at an average of 1.9% per annum between 1980 and 2015 for which data is available, capital employed has increased at a CAGR (compounded annual growth rate) of 14% during the timeframe. “One of the key reasons of such low growth in employment has been the increasing capital intensity of the Indian industrial sector,” observers said.”

While labor has decreased within the nation, the increase in capital makes up for that fact. As a result, India is now seeing record growth rates. The work force in India has become more efficient than ever, and the production output indicates so. So long as India continues to implement this positive change, they will continue to economically grow at a rate much higher than any other country in the world.

Conclusion

For the first time in many years, India is thriving economically. It is important to recognize that they are a developing nation, thus their growth rates will be higher than that of a developed nation – still, projections indicated by the IMF and the Solow Model are promising.

With a population of nearly two billion people, it is important for India to continue to thrive on an upwards trend economically. If the nation continues to implement the strategies correlated to their current finding, it is realistic to expect the nation to be significantly well off in the coming years compared to where they are at this present moment.

Article Link: IMF forecasts 7.4% growth for India in FY19

Works Cited

“IMF Forecasts 7.4% Growth for India in FY19.” The Economic Times, 23 Jan. 2018, economictimes.indiatimes.com/news/economy/indicators/india-to-grow-at-7-4-per-cent-in-2018-imf/articleshow/62607671.cms.
“India Inc Deploys More Capital than Labour.” The Economic Times, 9 June 2017, economictimes.indiatimes.com/news/company/corporate-trends/india-inc-deploys-more-capital-than-labour/articleshow/59064936.cms.

Farmer Insurance through Minimum Support Price

by Smeet Butala

Motivating article: https://timesofindia.indiatimes.com/business/india-business/budget-woos-farmers-government-promises-higher-msp-and-announces-multiple-farm-schemes/articleshow/62745263.cms

Introduction

India’s 2018 budget has promised, as of now, to set the minimum support price (MSP) for kharif crops at 50% above the cost of production. This is in an effort to help India’s farmers, beset by countless woes, by providing them with a source of price insurance. The budget also pledges to provide a host of schemes and mechanisms intended to help rural India. Currently included is an increase in the institutional farm credit target from ₹10 lakh crore to ₹11 lakh crore, as well as a scheme to provide crop loans to tenant farmers. The budget also lists two ₹10,000 crore funds for fisheries and animal husbandry, as well as a ₹200 crore fund for the cultivation of highly specialized medicinal or aromatic plants. The finance minister suggested providing a 100% deduction to registered Farmer Producer Companies that have annual turnovers of up to ₹100 crore. For the MSP, the government will likely continue to use the A2 formula to fix it, while many farmers’ organizations want the C2 formula to be used instead.

The A2 cost formula takes into account the cost of various inputs (seeds, labor, capital, etc.). The C2 cost formula, the comprehensive cost, includes the cost of family labor, the rent of owned land and interest on owned capital in addition to the factors in the A2 formula. Clearly, the C2 formula is almost always higher than the A2 formula, and is what various farmers’ organizations want the government to use when calculating the MSP for kharif crops; however, the government has hinted that it will continue to use the A2 formula instead, thereby setting a lower MSP and saving money for the government. The figure below contains the projections for the (current) 2017-2018 kharif season, with each value listed as the estimated cost of production per quintal and the MSP calculated on the A2 cost. For some crops, like paddy, the MSP is 84.5% over the A2, but for others, like jowar, it barely hits 40% over. And worse, we see that the MSP doesn’t even cover the C2 cost for a number of crops: jowar, ragi, moong, sunflower, sesamum, nigerseed, and cotton (Damodaran).

MSP.png
From http://indianexpress.com/article/india/the-cost-plug-50-percent-swaminathan-formula-mirage-agriculture-sector-minimum-support-price-4715922/

Minimum Support Price

The concept of the MSP is essentially a commodity price insurance for various crops, particularly kharif crops in this case. It states that, after a certain date, the government of India promises to purchase crops these crops from the producers at the prices stated, and these are stated well in advance, around the time when these crops would be planted. The purpose is to still encourage production of these necessary crops by providing a source of stable income for the farmers should the crop be bad, or should there be a bumper crop. However, due to the abysmal living conditions for farmers in India currently, the MSP has been a frequent target of farmers’ organizations, claiming that is it too low to properly support farmers in the country.

One major effect of the insurance provided by MSP is that it induces moral hazard, particularly ex ante moral hazard. Since the MSP is still a price, there must be a crop to sell, and so farmers are unlikely to be unproductive and allow their crop to go to waste. Thus, MSP still encourages hard work over shirking. However, MSP is quality-blind. A farmer could grow the lowest quality bajra possible, or the strain requiring the least number of inputs, irrespective of quality, and the government would still be bound to buy it from the farmers. Thus, the insurance that the government will indeed purchase the crops incentivizes the farmers to grow varieties with the lowest costs of production.

Another issue with MSP is that it only exists for a certain number of crops. If farmers of a certain crop, one not covered under MSP, feel that the next growing season may be too volatile, they may shift instead to a crop under MSP. This not only has the potential to flood the market for the good, it creates a skill problem. The farmers who switch to an MSP-covered crop from a non MSP-covered crop are much less likely to know how exactly to farm the new crop, and will be more likely to produce more failed crops as a result.

The MSP is also a form market intervention in the sense that it introduces the government as a consumer, and a consumer with a fixed price. This forces other consumers, particularly wholesalers, to have to compete with the government on price. In general, this implies that the prices are pushed upwards by the government intervention. Coupling this with the result of the moral hazard issue above, the prices that are set will not only be high for standard quality crops, those will be the prices for low quality crops, thus causing the market to be even more overpriced that it would nominally appear to be.

Conclusions

Unfortunately, data shows that only about 6% of farmers even benefit from MSP, and that there is widespread misinformation and lack of awareness amongst farmers: only around 24% of farmers in rural India were aware (Aditya et al). Compounding this, there are significant issues regarding storage of these crops, something that the government is often unable to properly do, thus causing the government not to accept the crops for lack of a place to store them. Compounding this with the issues listed above, there may need to be significant changes in policy or public outreach regarding MSP before it can begin to have its intended effect.

References:

Aditya, K. S., et al. “Awareness about Minimum Support Price and Its Impact on Diversification Decision of Farmers in India.” Asia & the Pacific Policy Studies, vol. 4, no. 3, 4 Sept. 2017, pp. 514–526., doi:10.1002/app5.197.

Damodaran, Harish. “The Cost+50% Swaminathan Formula Mirage.” The Indian Express, 22 June 2017, indianexpress.com/article/india/the-cost-plug-50-percent-swaminathan-formula-mirage-agriculture-sector-minimum-support-price-4715922/.

Mohan, Vishwa. “Budget Woos Farmers: Government Promises Higher MSP and Announces Multiple Farm Schemes.” The Times of India, 1 Feb. 2018, timesofindia.indiatimes.com/business/india-business/budget-woos-farmers-government-promises-higher-msp-and-announces-multiple-farm-schemes/articleshow/62745263.cms.

Measuring and Understanding Poverty in Colombia

By Valentina Forero Gonzalez

Introduction

November 30 of 2016 was a historical day for Colombia. After more than 50 years, the government of President Juan Manuel Santos and the Revolutionary Armed Forces of Colombia (FARC) signed a peace agreement that culminated the longest-running civil war in the world. The peace deal is an extremely controversial issue. Supporters of the agreement emphasize the urgency of reconciliation to prevent any more deaths and work towards less poverty, especially in the most afflicted rural sector. Meanwhile, opponents contend that the deal is too lenient and will not serve justice. However, the one argument both sides seem to agree on is that violence has to come to an end in order for the country to reduce poverty and inequality (Wyss, 2016).

The last report by the National Administrative Department of Statistics (DANE) on poverty concluded that, overall, poverty and inequality decreased in the country in 2017. According to Maria Alejandra Medina, columnist of one of the main newspapers in the country, in eight years, 4.3 million people overcame poverty based on their income. Yet, she explains, there are some figures of poverty that are still subject of concern. In order to understand why these figures are significant, it is necessary to first understand what they are (Medina, 2018).

Measuring poverty

People defined as poor live below some minimally acceptable level of well-being. Different poverty measures can lead to different conclusions about a population depending on the factors that are believed to influence the measurements. On a first level, poverty will be determined by the choice of well-being indicator. Therefore, whether the indicator is income, consumption, access to education, health, etc. will be key to define policy goals in the future. On a second stance, the choice of poverty line, that is, the choice of the minimally acceptable level of the indicators is essential to analyze the incidence and prevalence of poverty (Schaffner, 2013).

In the case of Colombia, the government measures poverty using two different approaches: the monetary and the multidimensional.

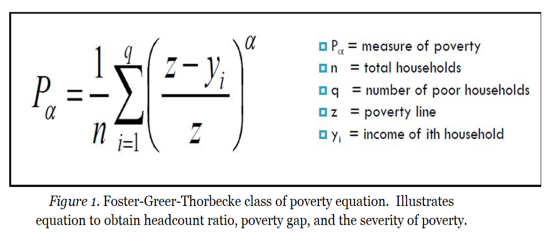
The monetary approach to poverty uses income per capita to calculate the incidence, depth, and severity of poverty. The governments has two different poverty lines: an extreme poverty line that delimits the income necessary to acquire a food basket that guarantees basic caloric needs; and a relative poverty line that defines the minimum income necessary to consume an acceptable level of goods and services. According to the DANE, an individual was considered extremely poor in 2017 if his/her income was below 116,330 COP per month (approximately 39 dollars per month or 1.3 dollars per day). The same report set the relative poverty line of the country at 250,620 COP per month (83 USD per month or 2.8 USD per day) (DANE, 2018). Furthermore, the DANE provides three different measures of poverty which can be calculated using the equation in Figure 1. The headcount ratio, which measures the incidence of poverty, gives the percentage of the population living below the poverty line (α=0 in equation). The poverty gap, which assesses the depth of poverty, calculates how far below the poverty line an individual is and the average shortfall in income (α=1 in equation). Finally, the squared poverty gap, which estimates the severity of poverty, provides an indication of inequality by giving each household or individual a weight depending on their income (α=2 in equation) (Development Initiatives, 2016). The results of the report will be further explained in the following section.Picture1

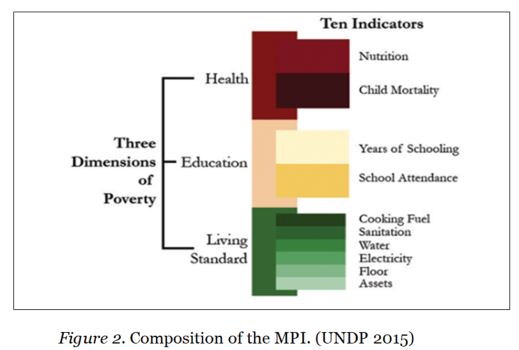
The second approach used by the DANE is the national Multidimensional Poverty Index (MPI). This indicator measures “the proportion of people who experience multiple deprivations and the intensity of such deprivations” (UNDP, 2015). It provides a more complete and complex indicator that allows for a better understanding of poverty and its possible causes and outcomes. Better measures of poverty at the same time will foster more targeted policies to end it. Compared to the monetary approach, the MPI uses ten indicators related to health, education, and living standards (Figure 2). To calculate the index, the deprivation of each person is weighted by the indicator’s weight and if the sum of the weighted deprivations is 33 per cent or more, then the person is considered to be multidimensionally poor (UNDP, 2015).
Picture2

The Results
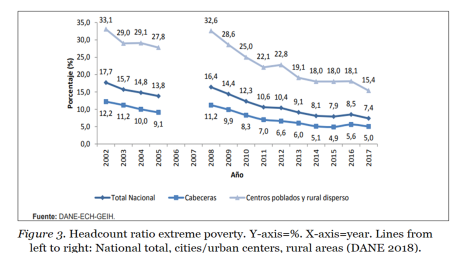
Figure 3 displays the headcount ratio over time for extreme monetary poverty, which went from 8.5% to 7.4% at the national level in 2017. The poverty gap registered was 2.7%, indicating that in average the income of the people living below the line is 2.7% lower than 1.3 USD per day. Finally, the severity of extreme poverty was 1.5%. Similarly, Figure 4 presents the graph for relative monetary poverty, which fell by 1.1 points to 26.9%. The poverty gap was 10.3% and the severity of poverty was 5.1% (DANE 2018).

Picture3Picture4

Likewise, Figure 5 illustrates the MPI over time, which went from 17.8% to 17%. According to Mauricio Perfetti, director of DANE, “among the deprivations that presented the most significant improvement for the MPI are low educational attainment, critical overcrowding and illiteracy” (Medina, 2018).

Picture5

All of the measurements of poverty decreased from 2016 to 2017. However, they also demonstrate the unequal reality of the country. Both the monetary and the multidimensional approaches prove that the rural regions present significantly higher poverty rates than urban centers.  Extreme monetary poverty in rural regions more than triplicated that of the capitals and relative monetary poverty in rural areas was about twelve percentage points higher. Likewise, the MPI in rural regions was more than three times that of the urban centers.

How Can We Explain These Differences?

Colombia is one of the most unequal countries in the world. However, in 2017 the Gini coefficient, which “measures the extent to which the distribution of income among individuals within an economy deviates from a perfectly equal distribution,” decreased from 0.517 to 0.508. Although this decrease should be taken as a positive sign, truth is that the country has had approximately the same inequality levels since the 1940s (Figure 6).

Picture6

The severe variation of poverty within Colombia has been studied by various economists. Nowadays, one of the main theses to explain inequality is the persistence of institutions. James A. Robinson in his essay “The Misery in Colombia” argues that “the extent and persistence of poverty and violence in Colombia” is a consequence of extractive political institutions in which a small group of elites exploit the rest of the population (2015). These political institutions, which include corruption, clientelism, and weak judicial systems, lead to inefficient economic institutions (such as lack of property rights) that only benefit those with power. This is consistent with the distribution of poverty in Colombia (Figure 7). The urban centers referred by Robinson as the core have significantly lower poverty rates today because elites have historically lived there. Therefore, they have implemented policies that make them more prosperous. The rural regions or the periphery, on the other side, have been exposed to extractive systems that uphold poverty and violence.

Picture7

In her article “What data on poverty figures are still worrying?” Medina states that the main areas of concern are the cities of Quibdó, Riohacha, Florencia, and Popayán, where the highest incidence of monetary poverty occurs. Consistent with Robinson’s theory, these cities where poverty persists are located in the periphery (Figure 7. Look at arrows).

Conclusion

The end of the Colombian conflict marks a historical moment in the country. The end of violence is an essential component to foster stability in the country and will surely improve the lives of millions of Colombians. However, contemporary theories of development have proven that in order to decrease poverty and inequality, the underlying causes them must be targeted. This means that, even in the absence of violence, as long as the government keeps in place an extractive system of corruption, lack of accountability, and economic insecurity, we cannot guarantee the effects of the deal.

*The link to the translated article can be found in  https://translate.google.com/translate?sl=auto&tl=en&js=y&prev=_t&hl=en&ie=UTF-8&u=https%3A%2F%2Fwww.elespectador.com%2Feconomia%2Fpese-buenos-resultados-que-datos-de-las-cifras-de-pobreza-aun-preocupan-articulo-745897&edit-text=&act=url

References

Departamento Administrativo Nacional de Estadística –DANE Marzo 22 de 2018 Boletín técnico Pobreza Monetaria y Multidimensional en Colombia Año 2017. Retrieved from https://www.dane.gov.co/files/investigaciones/condiciones_vida/pobreza/bol_pobreza_17.pdf

Development Initiatives (Jul. 2016). Definitions and Measures of Poverty. Devinit.org. Retrieved from http://devinit.org/wp-content/uploads/2016/07/Definitions-and-measures-of-poverty.pdf

Medina, M. A. (Mar. 22, 2018) ¿Qué datos de las cifras de pobreza aún preocupan? El Espectador. Retrieved from https://www.elespectador.com/economia/pese-buenos-resultados-que-datos-de-las-cifras-de-pobreza-aun-preocupan-articulo-745897

Robinson, J. (2015). The Misery in Colombia. Desarrollo y sociedad. 9-90. 10.13043/DYS.76.1. Retrieved from https://scholar.harvard.edu/files/jrobinson/files/the_misery_in_colombia.pdf

Schaffner, J. (2013). Development Economics: Theory, Empirical Research, and Policy Analysis. Chapter 5, page 85.

United Nations Development Programme UNDP (Mar. 2015). Training Material for Producing National Human Development Reports. United Nations Development Programme: Human Development Reports. Retrieved from http://hdr.undp.org/sites/default/files/mpi_trainingmaterial_mcc_mk_clean_june_2015.pd

Wyss, J. (Dec. 01, 2016). Colombia’s congress passes historic peace deal with guerrillas, but battles remain. The Miami Herald. Retrieved from http://www.miamiherald.com/news/nation-world/world/americas/colombia/article118192178.html


Reducing Poverty: One Grain at a Time

By Nathan Ellis

Eastern Cape
Provincial Premier Phumulo Masualle


Summary

The article “Eastern Cape gravitates towards breaking chains of poverty” outlines the variety of ways that the Eastern Cape of South Africa plans to reduce poverty and stimulate the economy. In order to achieve provincial premier Phumulo Masualle’s goal of turning the area into the “breadbasket of the Southern African Development Community region,” the Eastern Cape’s government has decided to focus on developing its agricultural sector (Miti, 2018, par. 2). To accomplish this goal, the government hopes to create jobs by collaborating with landowners to allow farmers to work the communal land in the area. Additionally, the communal farmers can add value by both producing and milling the agricultural commodities locally and exporting the goods so that they serve as a source of revenue. Local milling is a profitable endeavor for the area as well, so the government wants to incentivize communal farmers to participate in this process in an attempt to stimulate the local economy (Miti, 2018, par. 13).

Off-take agreements have been signed with Nestle SA and Chicory SA in order to encourage and provide reassurance to farmers to plant, cultivate, and harvest their crops. These agreements ensure there is a market for the agricultural goods produced by farmers and provides them with a defined role in the area’s commodity export market (Miti, 2018, par. 8). These seemingly positive measures for economic development beg an important question to consider – why were farmers not already participating in these ventures? The answer may provide theoretical insight about whether it is truly in the Eastern Cape’s best interest to pursue these efforts.

Reasoning

To learn why farmers were not participating in these agricultural ventures, it is necessary to understand the previous milling procedures in place. In South Africa, deregulating the maize industry resulted in three milling facilities dominating the industry and increasing prices of maize meal for consumers (Abu and Kirsten, 2015, p. 4). Initially, farmers chose to participate in these large-scale, centralized milling operations. However, when they wanted to sell their maize, farmers were required to transport their cultivated crops to the large milling facilities (Pichulik, 2013, par. 14). This expensive and laborious process might have made it necessary for farmers to obtain loans in order to finance their efforts and cover costs. However, farmers likely faced credit constraints because lenders may have viewed their investment as risky and unlikely to be repaid due to new added costs (such as transportation) to the borrower. Without the ability to afford this on their own, farmers may have been unable to remain competitive in the large-scale milling market.

The new off-take agreements signed by the government provide assurance to farmers that a market for larger-scale production exists before farming begins (Miti, par. 8). These off-take agreements serve as a form of collateral for farmers when they try to obtain credit from lenders to purchase necessary milling equipment because it shows a defined market for the agricultural output produced. The lender may now view the farmer as more likely to be able to repay post-milling because of the expected revenue source from Nestle SA and Chicory SA. Additionally, the agreements help minimize price risk by allowing the buyer to negotiate a price before production, which can help safeguard against future price changes if a shock occurs. Now, the farmers are no longer credit constrained in their efforts to get a loan to participate in milling (Goldfarb and Busch, 2007, par. 2). The sellers are also able to obtain a minimum level of return on their choice to produce maize, which reduces the accompanying risk of production (Goldfarb and Busch, 2007, par. 3). Because these off-take agreements did not exist previously, farmers may have been unable to obtain credit to participate in the milling process, as the lenders were uncertain if there would be a market for buyers of maize. Thus, they might have been unwilling to lend because they were unsure whether the farmers would be able to repay the loan. These credit constraints may have served as the driving force behind farmers’ prior milling inactivity.

Technological knowledge and available information also play large roles in farmers’ behavior and production habits. Technical change provides the opportunity for economic growth by increasing productivity and long-run output, especially in countries with a heavy reliance on the agricultural sector in their economy. It can reduce poverty for groups in developing countries by allowing farmers to produce and sell a higher quantity of crops at a more efficient rate (Schaffner, 2014, p. 523). However, in order for technological change to make a difference on a local level, farmers must know about its existence, how to use the new equipment, as well as the costs and benefits (Schaffner, 2014, p. 527). Fortunately, crop insurance exists to protect farmers against agricultural loss due to weather or a decline in commodity prices (Schaffner, 2014, p. 530). It is reasonable to think that one reason the communal farmers in the Eastern Cape were not previously participating in milling efforts is because they required proper knowledge about the technology’s accessibility or how to use the machinery. The farmers may not have been aware this technology existed previously. Alternatively, they could have determined that the cost of acquiring, installing, and learning how to use the machinery outweighed the long-term benefits of higher output. This market uncertainty could have been the major cause of prior inactivity in milling and the off-take agreements may be just what the Eastern Cape needs to motivate farmers to participate in these new efforts.

Solutions

Based on this analysis, the provincial government of the Eastern Cape should continue to encourage the economic development of communal rural spaces with a few added provisions not mentioned in the original article. First, the government must continue to show that a market exists for the farmers through increased off-take agreements. These agreements should continue to alleviate some of the credit constraints farmers face when trying to obtain a loan to participate in milling.

The government must also invest in agricultural extension agents that can teach and instruct the farmers about how to use the new milling technology. Although this extension agent work can be difficult and expensive, it is an important investment for the government to make in order to ensure farmers maximize efficiency in production in the long run. This will also provide farmers confidence in their ability to use the technology, allowing them to gain “new information,” easing some of their perceived risk in the process, and making them more willing to adopt the technology (Schaffner, 2014, p. 526).

Finally, the government may want to consider regulating the maize production industry and/or encouraging the use of micro mills: local mills that are communally run. Although micro mills will not directly compete with the three major millers in South Africa, they can serve as an alternative to create economic stimulation through local job creation and incentivize development. The Eastern Cape’s government is moving in a positive economic direction, and these initiatives serve as the next step in reducing the region’s poverty moving forward.

Article Link: “Eastern Cape gravitates towards breaking chains of poverty”

Works Cited

Abu, O., & Kirsten, J. F. (2009). Profit efficiency of small- and medium-scale maize milling          enterprises in South Africa. Development Southern Africa,26(3), 353-368.               doi:10.1080/03768350903086663

Goldfarb, R., & Busch, J. (2007, August 27). Three Important Elements of Offtake Agreements   @EthanolMagazine. Retrieved May 1, 2018, from             http://www.ethanolproducer.com/articles/3242/three-important-elements-of-offtake-         agreements/

Miti, S. (2018, March 16). Eastern Cape gravitates towards breaking chains of poverty. Retrieved May 1, 2018, from https://mg.co.za/article/2018-03-16-00-eastern-cape-gravitates-towards-breaking-chains-of-poverty

Pichulik, M. (2013, June 14). Micro-milling: An obvious solution. Retrieved May 1, 2018, from https://www.dailymaverick.co.za/opinionista/2013-06-14-micro-milling-an-obvious-   solution/#.WujyFtMvw1g

Schaffner, J. (2014). Development economics: Theory, empirical research, and policy analysis.     Hoboken, NJ: Wiley.

Asset Quality Improves for India’s MFIs

The following article reports on optimistic trends found on the loaner’s side of micro-finance, although there is not much information on the impact the borrowers have experienced.

This article reports on the grading done by Indian financial rating firm, CRISIL. The article “Asset quality of microfinance institutions improves: Crisil” written by Gayatri Nayak, was reported by The Economic Times, a subsection of the Indian newspaper India Times. The report comes with optimistic news of the microfinance institutions, whether comprised of small banks or non-banks, seeing improvements in their loan portfolios especially after an economic shock. Particularly when it came to stability in asset quality. As defined by the United States Federal Deposit Insurance Corporation, asset quality rating reflects the quantity of existing and potential credit risk associated with the loan and investment portfolios, other real estate owned, and other assets, as well as off-balance sheet transactions [1]. The report attributes this rise to three factors: the decrease in delinquencies, rising cumulative collection efficiencies, and an increase in investor support. However, do these attributes show any similar optimistic changes to the actual borrower?

The first of the attributes to the improvement in asset quality comes from more loans being paid back. Delinquencies have dropped from 7.6% (June 2017) to 5.6% (December 2017) of payments that are 30 days past due. Similar results for 60 days past due: 6.8% (June 2017) dropped to 5.3% (December 2017). Meaning that there are fewer people who Screen Shot 2018-05-01 at 22.56.26are not paying back the money they have borrowed. According to CRISIL’s senior director, Krishnan Sitaraman, lower delinquencies indicates that borrowers are paying more than one installment and that existing delinquents are paying back what they owe. Having a greater payback rate is an important thing to point out. A greater payback rate signifies that more borrowers are finding successful output from their investments. Hence, successful investments can lead to greater economic development in theory.
The second attribute highlighted has to do with the rise of cumulative collection efficiencies. In other words, the collection of debt has increased. CRISIL reported that there has been a 99% increase in the efficiency for disbursements made after April 2017. An increase such as this one is indicative of an improving market environment and better borrowing discipline. These two outcomes are a hugely positive outlook for India’s
micro-financial markets, who have suffered from demonetization in 2016 and early 2017. Demonetization is, according to Investopedia, the act of stripping a currency of its legal status of being an official medium of payment [2]. In November 2016, India’s government called for the demonetization of all 500 and 1000 rupees banknotes [3]. Given such short notice, announcing such radical plan caused money shortage leading there to be a serious disruption in economic output [4]. Therefore, seeing the market make a rebound such as this one, gives strength to the microfinance market as a viable stimulant of the economy. However, the microfinance market is still susceptible to further effect from the demonetization. CRISIL estimates that 5-7% of credit was lost due to the demonetization. So, it is a critical focus for micro-finance institutions to have increased funding in order to provide a cushion from sudden shocks.

Such funding results in the third attribute mentioned by CRISIL, Investors. There has been an increase in investor support toward the micro-finance sector. According to CRISIL’s report, investors have especially invested in both equity and debt capital markets. Since the events of the demonetization, CRISIL estimates micro-finance institutions to have raised around Rs 4,000 crore of equity and Rs 7,000 crore of debt from their investors. Refinance institutions and larger banks have also continued their funding for micro-finance institutions. These lendings are facilitated by giving priority for transfers to occur toward micro-finance institutions [5]. As discussed earlier, more funding for micro-finance institutions allows for market shocks to have less of an effect on the institutions being able to continue lending out loans regularly.

This report highlights how much micro-finance institutions impact can have in analyzing the health of the credit market. Based on CRISIL’s latest analysis, there seems to be a lot of growth currently happening in India; at least as of February, when this report was written. Having this report shines an optimistic light on micro-finance institutions’ role in supporting the economy. India still has an economy recovering from the demonetization, micro-finance institutions are seeing greater frequencies of paybacks from their borrowers. However, an important thing to point out is whether or not the borrowers are seeing a greater impact on their loans as well.


A microcredit market possesses two types of borrowers: risky borrowers and safe borrowers. Risky borrowers invest in risky projects with a particular probability of that project succeeding, thus making returns on their investment in order to pay back the loan. A safe borrower invests in a safe project in which they will always be able to pay back the loan.Screen Shot 2018-05-01 at 22.57.01

Now with the context of both types of borrowers, it becomes unclear as to how much of a positive impact micro-finance institution are having in helping the economy. Particularly low-income citizens rebound from the effects of the demonetization. Due to having an increase in the number of loans that are paid back, at least three main outcomes could come as a result. One, more safe borrowers leading to safer assurance that payment will happen back to the lender. Two, there is an increase in risky borrowers actually having their risky projects succeed. Or three, a mix of both types succeeding. Personally, I believe given a recent financial shock, borrowers will most likely be risk-averse, meaning that they plan to avoid as much financial risk as possible. Therefore, the most likely case is the first. In this case, there are more safe borrowers in the market leading to less delinquent accounts since safe borrowers always pay back their loan.

Sources:

[1] https://www.fdic.gov/regulations/safety/manual/section3-1.pdf

[2] https://www.investopedia.com/terms/d/demonetization.asp

[3] https://rbi.org.in/Scripts/BS_PressReleaseDisplay.aspx?prid=38520

[4] https://www.economist.com/news/finance-and-economics/21711035-withdrawing-86-value-cash-circulation-india-was-bad-idea-badly

[5] https://www.crisil.com/en/home/newsroom/press-releases/2018/02/asset-quality-improves-in-microfinance-demo-blues-fade.html

Main Article: https://economictimes.indiatimes.com/markets/stocks/news/asset-quality-of-microfinance-institutions-improves-crisil/articleshow/63032858.cms

Private or Public Sector Banks? A discussion of efficacy and perception of Indian Banks

Introduction

Between 1955 and 1969, the Indian government bought majority shares in the previously private banks. This trend has continued to the point where 83% of banking business in India is conducted by banks that are primarily owned or controlled by the government2, according to Banerjee et. al.(2004). The largest acquisition act was the Banking Companies Act of 1969, which stated that the government would acquire control to “serve better the needs of development in the economy in conformity with national policy and objectives”. While the debate on state control versus private free markets has continued over time, the both systems have often failed in execution due to fraud and inefficiencies.

Blog

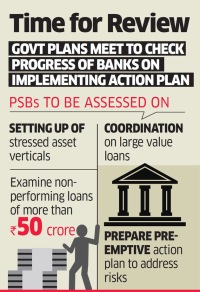
This debate has especially flared uprecently, with the Indian government implementing an action plan to assess these public-sector banks (PSBs) on their abilities to address risks and examine non-performing loans under the Enhanced Access and Service Excellence(EASE) reform agenda1. These actions came about in response to scams committed by the Punjab National Bank, which prompted officials such as Chief Economic Advisor Arvind Subramanian to propose the privatization of banks3.

However, others like famed economist Muhammad Yunus has thrown his lot against the privatization of the PSBs, saying that they did not demonstrate a prospect of significant increase in performance3. Yunus’ credibility comes from his lauded heading of the Grameen Bank and its efforts in microfinance in Bangladesh, for which he received a Nobel prize4.

Analysis

In a study conducted by Agrawal and Yadav (2011), it was shown that not only do privately conducted banks perform better but they also have better growth projections and sustainability. This was measured through net profit, return on assets, and Net Performing Assets ratio6.

Banerjee supports this analysis in his work that builds on a previous paper that dealt with microfinance in rural India2. In a previous paper, Banerjee discusses the lack of results from microfinance access in rural India. This time, however, Banerjee sees under-lending as a way in which banks are not responsive to government’s agenda2. This is the same for both private and public banks. This implies that government control of the banks has not led to the desired results stated in the Banking Companies Act of 1969. Rather, Banerjee continues on to say that PSBs maintain an air of almost business complacency in that they lack the aggressiveness in pursuing accounts and incentivizing deposits2.

This makes sense intuitively as a person’s attitude towards government may shift his or her preference towards or against a PSB. Distrust towards the government due to any combination of corruption or grievance. Ultimately, the problem is the lack of uptake. Underutilized microfinance institutions cannot bring about greater economic growth, whether owned by the state or not. Yet, it appears that that potential growth is actually limited by the government’s control.

In a 2004 paper, Barth, Caprio, & Levine raised another cautionary tale. In the paper they warned against government control over banking activities. They found that strict policies against private banks were the ideal way to ensure efficient banking systems and to protect against fraud7. Specifically, enforced transparency and incentivized corporate control by the private sector’s private agents were found to encourage good banking practices7.


Effect of PSBs on MicroCredit

PSBs should actually be more attractive to borrowers, as they can offer lower interest rates, controlled by the government. While private banks offer greater overall trends of growth, they also must adjust for risk of liquidity. As PSBs are more stable, the interest rates can remain low and technically should entertain more loans than private banks. However, studies show that while there is a dearth of uptake in general, people go against theory to lend from private banks rather than PSBs. Now, this may be due to the risks of suffering negative consequences of fraudulent activity by PSBs. However, Banerjee also lacked the aggressive nature of private banks.

This comes down to a Moral Hazard issue.

Ex Ante Moral Hazard is when a borrower misrepresents his or her own information in order to secure a lower interest rate or larger loan by presenting a lower risk loan to the bank. This can be largely affected by whether a bank is a PSB or private. People may perceive PSBs to have a greater ability to investigate this sort of information, leading to a greater uptake in private banks whose capabilities may be or may be perceived to be lower than a PSB.

Ex Post Moral Hazard is when a borrower chooses to repay his or her loans so that future transactions may be preserved. Failure to repay may actually more easily reconciled at private banks due to the idea that 1) private banks may not have or may not have the ability to acquire information on a borrower’s ability to repay and private banks might have more flexibility in its policies as the PSB must adhere to government protocol. In both situations, it seems that a private bank may be more attractive to a borrower despite higher interest rates.

In order for a PSB to be efficient, it will want to minimize risk. However, this is counterintuitive to the policies that mitigate that risk. Adverse selection is one approach in which a financial institution may choose higher interest rates to mitigate risky loans, but unintentionally weeding out those with safer loans who would not pay for that risk. A possible explanation, then, for a greater uptake of loans with private banks is that riskier borrowers are really the ones on the margin, leading them to participate in the microfinance of private banks.


Conclusion

So, are private banks a solution to the problems of fraud, growth, and microfinance? Ultimately, it would seem that it might be with the proper conditions. As stated before in the work by Barth, Caprio, & Levine, a set of strict conditions allow for some of the same benefits of a PCB. The works by Banerjee and Agrawal determine for us that in terms of aggregate economic growth, private banks provide more and have greater incentives to succeed. However, with the strict conditions, perhaps the threat of fraud and under-lending can be solved, in microfinance as well as aggregate growth.


Works Cited:

1Tiwari, Dheeraj. “Finance Ministry to Check Readiness of PSBs on Bad Loan Frauds.” The Economic Times, 10 Apr. 2018, economictimes.indiatimes.com/news/economy/policy/finance-ministry-to-check-readiness-of-psbs-on-bad-loan-frauds/articleshow/63703012.cms.

2Banerjee, Abhijit V., Shawn Cole, and Esther Duflo. 2004. “Banking Reform in India,” mimeo, Massachusetts Institute of Technology, http://economics.mit.edu/files/779.

3“Nobel Laureate Yunus Not in Favour of Privatisation of PSBs in India.” The Economic Times, 8 Apr. 2018, economictimes.indiatimes.com/industry/banking/finance/banking/nobel-laureate-yunus-not-in-favour-of-privatisation-of-psbs-in-india/articleshow/63665872.cms.

4“Muhammad Yunus – Biographical”. Nobelprize.org. Nobel Media AB 2014. Web. 1 May 2018. <http://www.nobelprize.org/nobel_prizes/peace/laureates/2006/yunus-bio.html&gt;

5“THE BANKING COMPANIES (ACQUISITION AND TRANSFER OF OF UNDERTAKING) ACT, 1969.” Internet Archive, 1969, archive.org/stream/THEBANKINGCOMPANIESACQUISITIONANDTRANSFEROFOFUNDERTAKINGACT1969/THE BANKING COMPANIES (ACQUISITION AND TRANSFER OF OF UNDERTAKING) ACT, 1969_djvu.txt.

6Agrawal, P, and AK Yadav. “A Comparative Study of the Public and Private Sector Bank with Special Reference to Punjab National Bank and HDFC Bank.” Journal of Business and Financial Affairs, OMICS International, 30 Nov. 2015, http://www.omicsonline.org/open-access/a-comparative-study-of-the-public-and-private-sector-bank-withspecial-reference-to-punjab-national-bank-and-hdfc-bank-2167-0234-1000155.php?aid=65942.

7Barth, James R. & Caprio, Gerard Jr. & Levine, Ross, 2004. “Bank regulation and supervision: what works best?,” Journal of Financial Intermediation, Elsevier, vol. 13(2), pages 205-248, April.

A Discussion on the Economy of South Africa: Past, Present, and Future

By: Brian Williams

Introduction

Good economic news has recently come out of South Africa, as the country experienced 3.1% GDP growth in the fourth quarter of 2017, and is now projected by the World Bank to exceed an earlier projection and have GDP growth reach 1.4% in 2018. While this is certainly something to take pride in, South Africa has some lofty goals for their future economic growth, as the government’s ambition is to achieve a 5% growth rate in the coming years. This post will analyze the historical growth of South Africa to gain a better understanding of future growth prospects for the Rainbow Nation.

Government Policy Analysis

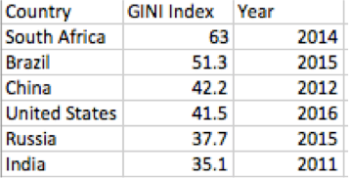
In order to sustain and even improve growth, Paul Noumba Um, South Africa’s World Bank Director, acknowledged that GDP growth in his country is being challenged by unemployment, inequality, and poverty.[1] The GINI Coefficient, a measure of the inequality of a country with values between 0 and 100%, is very high in South Africa relative to other countries at 63. This means that a small percentage of the population owns a large proportion of the wealth.[2]

GINI index
The GINI Index of South Africa and important countries

     The South African Department of Trade and Industry highlights that companies will have a large pool of both semiskilled and unskilled workers to potentially employ as a major draw for investment, which would reduce the high inequality prevalent in the country, as well as help grow the economy with more people working.[3] To reduce poverty and close the inequality gap, Julie Schaffner’s textbook on Development Economics describes government policies that take into account the financial constraints the poor are faced with, such as bringing markets into remote areas whose inhabitants are commonly poor due to their large proximity away from financial centers, along with policies that “explicitly create new assets owned or used by the poor,” as the most effective. These policies perform multiple tasks, as they promote a reduction in inequality along with promoting growth in the economy with equal success to policies targeting those with average income.[4]

 BRICS Analysis

To get a better picture of South Africa’s future, it’s past economic progress can be a useful guide. BRICS is an acronym used to group the countries of Brazil, Russia, India, China, and South Africa together. First established by Goldman Sachs economist Jim O’Neil in 2001 to identify strong, growing economies, BRICS has advanced into “a new and promising political-diplomatic entity, far beyond the original concept tailored for the financial markets,” with Summits between member countries held annually and group decisions made often.[5] In his paper Divergence, Big Time, Lant Pritchett studied the average growth rates of 17 currently high-income countries from three different time periods. Divergence in this case is defined as the state when the GDP per capita of wealthy countries increases quicker than the GDP per capita of other countries, creating a greater divide between the two groups.[6] The table below presents a similar study to Pritchett’s, conducted with data for the BRICS countries over three different time periods.

GDP Growth Rate.png
Growth Rates of BRICS countries over 3 different time periods

One observation from this analysis is how South Africa has fallen from having the highest GDP per capita to having the fourth highest of the BRICS countries. Couple that with their consistently low average growth rates relative to the other countries (1.80, -0.467, and 1.586), and it becomes a signal that South Africa is diverging away from countries like Brazil, China, and Russia in terms of economic growth per capita.

OECD Analysis

The economies of the BRICS countries are often thought of as less developed relative to the advanced economies of the world, which are typically considered to be the OECD countries. Pritchett defines the OECD countries as European countries, their offshoots, and Japan. In his work, Pritchett estimated “that from 1870 to 1990, the ratio of per capita incomes between the richest and the poorest countries increased by roughly a factor of five,” which is a signal that divergence had occurred between the “developed” OECD countries and the other “less developed” countries.[7] By comparing the adjusted income per capita of South Africa and the OECD member countries, as shown in graph below, it becomes apparent that the divergence Pritchett discussed has occurred here as well.

Income per capita divergence.png
Income per Capita Divergence between OECD countries and South Africa

Numerically, the World Bank estimates that in 1971, the adjusted income per capita in South Africa was 728.245, while for OECD member countries it was 2,547,569. Had convergence occurred between these two countries, it would be expected that this gap of approximately 350% would have been reduced by today as South Africa’s economy would have grown faster than the OECD member’s economies, but this is not what happened. In fact, the current adjusted income per capita of South Africa is estimated to be 4,258.973, while this statistic for OECD member countries is now approximately 30,785,193, over 700% greater than South Africa’s. This exceeds Pritchett’s estimation and shows a high degree of divergence between South Africa and the developed OECD countries.[8]

Future Growth Potential

Even with the positive news of growth for the South African economy, the government still believes that higher growth rates can be achieved. Taking a step back, it may be ideal for the South African Government to decide if this goal is actually feasible and sustainable. One calculation that can help determine a countries future growth is based off of the observations from a graph included in the 1997 paper On the Evolution of the World Income Distribution penned by Charles Jones. Jones compared a countries 1960 GDP per worker to that of the United States and found that for most countries, those that had a GDP per worker greater than 15% of the United State’s converged, or grew towards the same value, whereas those with a GDP per worker less than that figure saw divergence.[9] For our experiment, we will compare South Africa’s 2016 GDP per worker to that of the United States use that to determine if convergence or divergence will occur in the future. No assumptions were made about the countries in Jones paper, as he simply observed a result from the raw data. The table below describes this relationship between South Africa and the Untied States, the reference country.

Jones analysis.png
Analyzing South Africa’s potential for future growth

Dividing 13614.28556 by 114512.8955 yields the approximation that South Africa’s ratio is 11.889% that of the United States. This is below the 15% threshold Jones observed for divergence, so if his findings hold than South Africa should be expected to further diverge away from the United States. As a result, with this evaluation, South Africa will not achieve their target goal of 5% growth, as they will be expected to grow slower than the United States, a country that averages around 2% growth annually.

Bibliography

[1] Winning, Alexander. “World Bank Raises South Africa 2018 Growth Forecast.”

[2] GINI Index-South Africa. Raw data. The World Bank.

[3] “Why Invest in South Africa.” Trade, Exports & Investment.

[4] Schaffner, Julie. Development Economics: Theory, Empirical Research, and Policy Analysis.

[5] Rachid, Biatriz. “Information about BRICS.”

[6] Pritchett, Lant. “Divergence, Big Time.”

[7] Pritchett, Lant. “Divergence, Big Time.”

[8] Income per Capita-South Africa and OECD countries. Raw data. The World Bank.

[9] Jones, Chad. “On the Evolution of the World Income Distribution.”

Source Articles:

https://www.moneyweb.co.za/news/economy/world-bank-raises-south-africa-2018-growth-forecast/

https://www.enca.com/money/sa-s-economy-grows-13-in-2017